The information below was excerpted from the us census burea - GED Prep
Question
The information below was excerpted from the U.S Census Bureau.
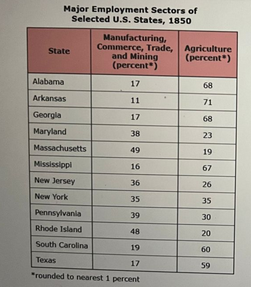
Which conclusion is corroborated by both the table and the map?
Answers
-
-
-
correct
-
Explanation
The correct answer is 3. Variances in the economies of the states played a role in the political distinctions between the North and the South.
The table provides clear evidence of significant economic differences between Northern and Southern states in 1850. Northern states like Massachusetts, Rhode Island, and New York show much higher percentages of employment in manufacturing, commerce, trade, and mining (ranging from 35% to 49%) compared to agriculture. In contrast, Southern states such as Alabama, Arkansas, Georgia, and Texas display much higher percentages in agriculture (59% to 71%) and lower percentages (11% to 17%) in manufacturing and related sectors. These stark economic differences reflect the industrialized nature of the North versus the agrarian focus of the South. Such fundamental economic disparities would naturally lead to divergent political interests and priorities between the regions, as each would advocate for policies beneficial to their dominant economic sectors. This economic divide aligns with historical knowledge of the period and helps explain the political distinctions that developed between the North and South, ultimately contributing to the tensions that led to the Civil War.
No Payment Cards Needed
Normally $120
$69/month
Subjects Included
- English Languages Art ( RLA)
- Mathematics
- Social Studies
- Science
Additional Features
- 4 GED® Subjects with Lessons and Practice Tests
- Over 2000 Practice Questions
- Over 2000 Quizzes in all Lessons
- Access to Exact answered Questions with explanations
- Detailed Analysis of Questions with Answers and Explanations
- 24/7 Live chat support
- 24/7 WhatsApp support
- One Full Month Access