The data presented in the table and graph originates from th - GED Prep
Question
The data presented in the table and graph originates from the Congressional Budget Office.
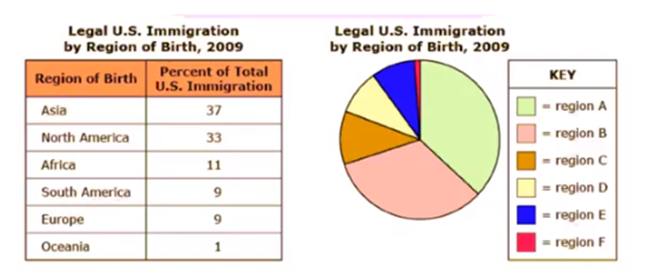
Which part of the graph represents the proportion of legal immigration originating from Asia?
Answers
-
-
-
-
correct
Explanation
The correct answer is D, representing Region A. From the table, the immigrants from Asia are at 37%, which is the highest proportion. As such, from the pie chart, the region with the highest % is region A.
No Payment Cards Needed
Ged Test Prep exam
Normally $120
$69/month
Subjects Included
- English Languages Art ( RLA)
- Mathematics
- Social Studies
- Science
Additional Features
- 4 GED® Subjects with Lessons and Practice Tests
- Over 2000 Practice Questions
- Over 2000 Quizzes in all Lessons
- Access to Exact answered Questions with explanations
- Detailed Analysis of Questions with Answers and Explanations
- 24/7 Live chat support
- 24/7 WhatsApp support
- One Full Month Access