The operations manager of a logistics firm is assessing the - GED Prep
Question
The operations manager of a logistics firm is assessing the load capacity of a medium-sized truck used to transport cylindrical water tanks. The truck's loading area is a flatbed with dimensions 27 feet in length and 8 feet in width. The manager has recorded the truck's fuel consumption while making deliveries from Atherton to Bakersfield, and then from Bakersfield to Castlewood, based on the connected routes shown on a map.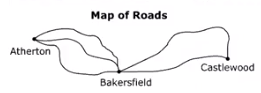
a) In preparation for potentially upgrading the fleet, the manager has documented the fuel efficiency of the medium-sized truck on five different delivery runs. The fuel efficiency data is as follows:
| Trip | Distance traveled (miles) | Fuel Efficiency (miles per gallon) |
|---|---|---|
| 1 | 100 | 6.0 |
| 2 | 200 | 7.5 |
| 3 | 200 | 6.5 |
| 4 | 250 | 6.0 |
| 5 | 350 | 7.0 |
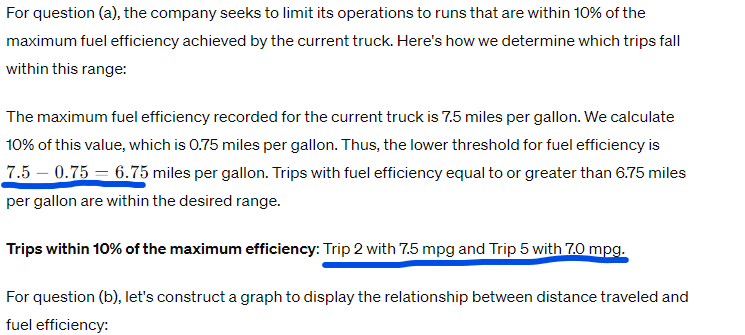
a. If the company seeks to limit its operations to runs that are within 10% of the maximum fuel efficiency achieved by the current truck, which trips fall within this range?
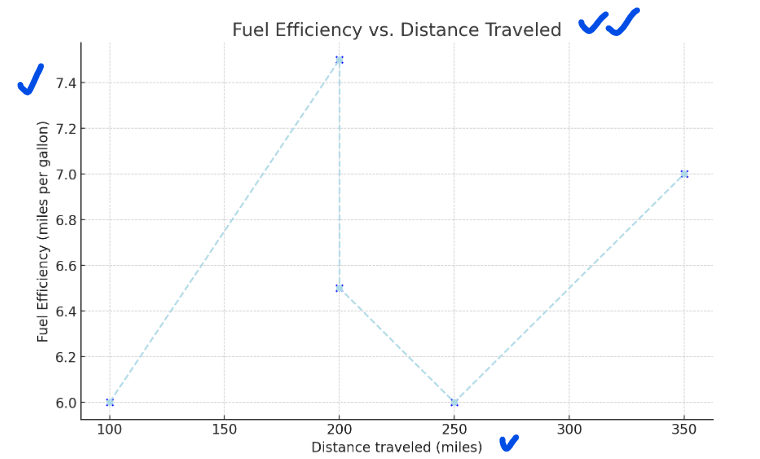
b. Using the data in the table above, the manager intends to create a visual representation to compare the distances traveled and the corresponding fuel efficiencies. Construct a graph to display the relationship between distance and fuel efficiency.
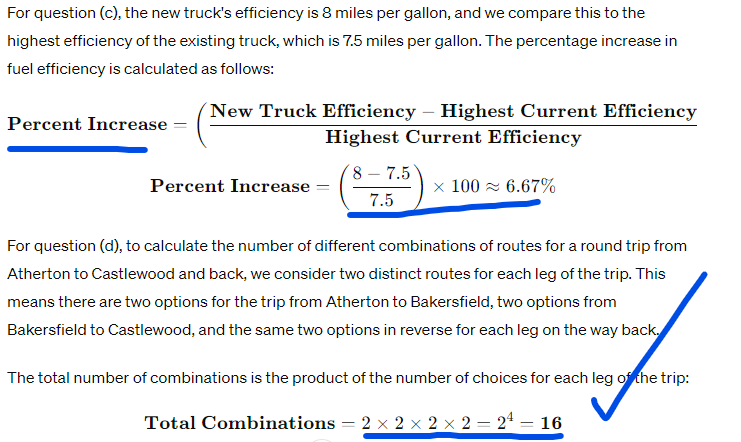
c. The company is considering the acquisition of a more efficient truck, which boasts a fuel efficiency of 8 miles per gallon. Calculate how much greater, in percentage terms, this new truck's efficiency is compared to the highest efficiency of the existing truck.
d. Given the map of roads between Atherton, Bakersfield, and Castlewood, if there are two distinct routes between each pair of cities, how many different combinations of routes can the truck take for a round trip from Atherton to Castlewood and back?
Answers
-
correct
-
-
-
Explanation
No Payment Cards Needed