The graph shows the solubility of several salts in water the - GED Prep
Question
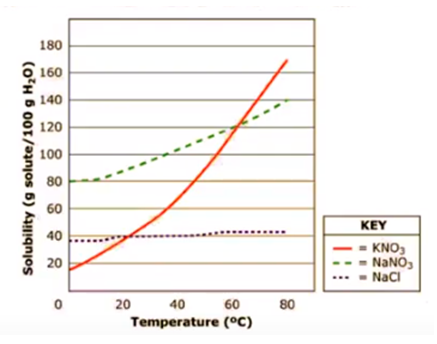
The graph shows the solubility of several salts in water. The three salts tested were sodium nitrate (NaNO3), potassium nitrate (KNO), and sodium chloride (NaCl). Knowing the solubility of these salts is important for producing the maximum yield of products like fertilizers and glass.
Which statement best describes the trends in the graph?
Answers
-
-
-
-
correct
Explanation
The correct answer is: Solubility increases as temperature increases.
The graph clearly shows an upward trend for all three salts as temperature rises, indicating increased solubility at higher temperatures. This is most pronounced for KNO3 (red line), which shows a steep increase in solubility as temperature increases. NaNO3 (green dashed line) also shows a significant increase, while NaCl (purple dotted line) shows a slight increase. This trend is consistent across all three salts, making option (d) the most accurate description of the overall pattern observed in the graph.
No Payment Cards Needed